


Most Linux performance triage starts with two tools you already have: ps for one-shot snapshots and top for an updating view. Both read kernel process data from /proc, which every distribution exposes by default. You will use them to answer practical questions: “what is eating CPU,” “why is memory tight,” and “which PID should I stop or renice.” If you plan to follow along on a fresh droplet, make sure you can sign in to your DigitalOcean account so you can spin up and test safely. We will start with quick wins, then add precision and customization so you can move from glanceable checks to repeatable investigations.
Mental model
ps prints a snapshot and exits. You decide which processes to select and which columns to print, then redirect, filter, or sort the text like any other command output. top stays open, refreshes at intervals, and lets you sort, filter, kill, or renice interactively from the keyboard. The two share column names and process state codes because they come from the same procps-ng family on most Linux systems. Keep that in mind when you map a column you liked in ps to the same field inside top.
Quick start: see “everything” safely
Run a broad listing when you first drop into a host. The classic BSD-style incantation is:
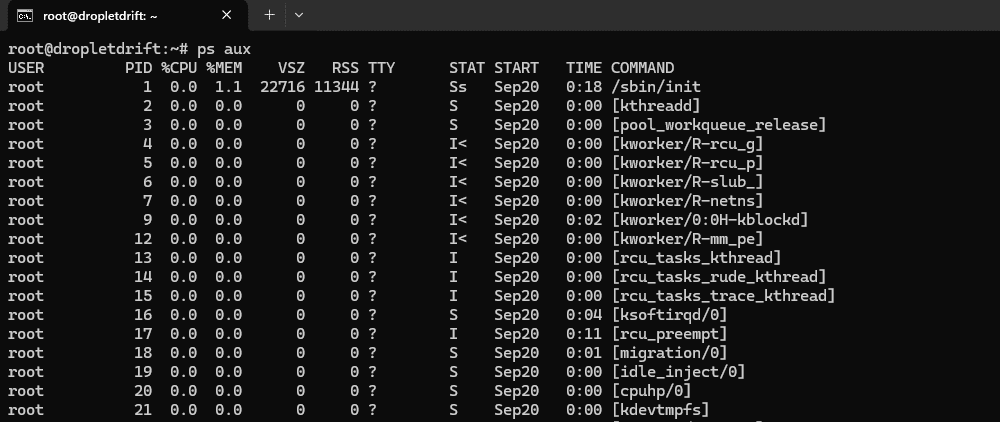
ps auxThis prints all processes for all users (a), includes processes without a TTY (x), and uses a user-friendly format (u). The aux spelling is historical and valid; do not add a leading dash in BSD mode. Use this for orientation, then pivot to more precise selections below.
If you prefer explicit control of columns, use the portable -eo form:
ps -eo pid,ppid,user,%cpu,%mem,stat,tty,start,time,cmd --sort=-%cpu

# root@dropletdrift:~# ps -eo pid,ppid,user,%cpu,%mem,stat,tty,start,time,cmd --sort=-%cpu
#    PID    PPID USER     %CPU %MEM STAT TT        STARTED     TIME CMD
#  75765    7287 www-data  2.6  8.7 Ss   ?        12:57:38 00:00:00 lsphp
#  75764    7287 www-data  2.0  9.4 Ss   ?        12:57:38 00:00:00 lsphp
# 75514 7287 www-data 0.9 9.2 Ss ? 12:51:35 00:00:03 lsphpThis prints one process per line with chosen fields and sorts by descending CPU. Replace --sort=-%cpu with --sort=-rss when memory is the focus. This pattern is predictable and script-friendly.
Read the columns that matter
You will repeatedly use a small set of fields:
PIDandPPIDidentify the process and its parent.%CPUandTIMEpoint to CPU consumers.%MEM,RSS, andVSZorient memory use.RSSis resident memory in RAM.VSZis virtual address space.%MEMisRSSas a fraction of physical memory.STATencodes process state, threading, and other flags; the leading letter is the run state.
These definitions match procps-ng’s semantics and are consistent between ps and top. They let you answer “who,” “how much,” and “what state” without over-parsing the full command line.
Two quick translations help during triage. An STAT starting with R means runnable or running, which often aligns with high %CPU. An S means interruptible sleep, common for idle daemons. You may also see flags like l (multi-threaded) or + (foreground in its group). These codes come from the same kernel states that top shows.
Precise selections with ps
Start narrow to reduce noise. To list only processes from one user:
ps -u postgres -o pid,%cpu,%mem,stat,etime,cmd --sort=-%cpuTo list a process tree by parent, sort by ppid and then pid:
ps -eo pid,ppid,user,stat,%cpu,%mem,cmd --sort=ppid,pidTo find a service and print full commands, include the command column and use a case-insensitive grep:
ps -eo pid,user,%cpu,%mem,stat,command | grep -i '[n]ginx'The bracket trick avoids matching the grep process itself. These patterns combine a clear selector with explicit columns, which makes the output easier to compare run to run.
Memory-centric view
When memory pressure is suspected, sort by resident set size and show swap:
ps -eo pid,user,stat,rss,vsz,%mem,cmd --sort=-rss

# root@dropletdrift:~# ps -eo pid,user,stat,rss,vsz,%mem,cmd --sort=-rss
#    PID USER     STAT   RSS    VSZ %MEM CMD
#   1260 mysql    Ssl  151860 1107424 15.4 /usr/sbin/mariadbd
# 75765 www-data Ss 122684 715752 12.4 lsphpInterpret RSS as “in RAM right now” and VSZ as the total address space. RSS includes shared library pages actually in memory; it excludes swapped-out pages. Use %MEM for quick ratios at a glance.
CPU-centric view
To capture bursts, sample multiple times:
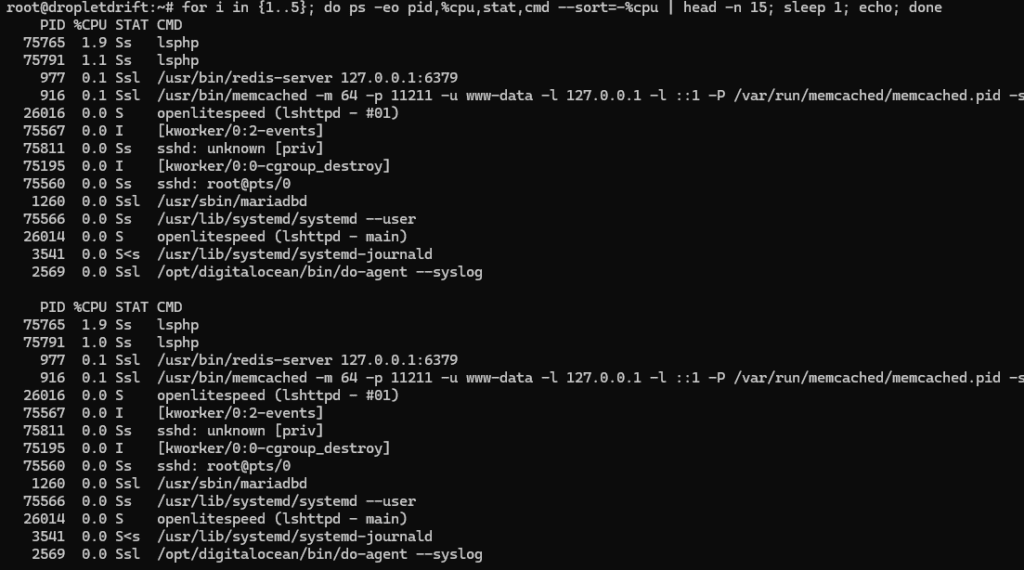
# as seen in the snapshot above

for i in {1..5}; do ps -eo pid,%cpu,stat,cmd --sort=-%cpu | head -n 15; sleep 1; echo; doneShort loops like this often reveal periodic jobs that a single snapshot can miss. Because ps exits each time, you can redirect every sample to a file for later comparison.
Move to top for live investigation
Launch top for an updating view:
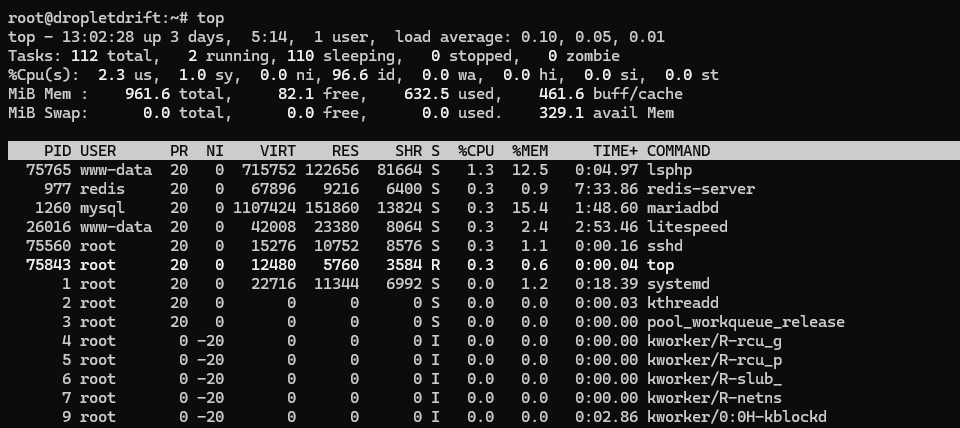
topBy default you will see a summary at the top and a task list below. top refreshes every few seconds, recalculates CPU usage, and keeps your sort key persistent once you set it. This real-time feedback is ideal when you need to confirm a fix as you apply it.
Core interactive keys you will actually use
Once top is open, use these keys without leaving the program:
Shift + P: sort by CPU.Shift + M: sort by memory.Shift + T: sort by cumulative time.c: toggle between bare program names and full command lines.k: send a signal to a PID.r: renice a PID.forF: manage fields, choose columns, and set the primary sort field./orL: search or filter tasks by text.1: toggle per-CPU breakdown in the summary if supported.
These controls come straight from the top man page and are stable across procps-ng-based distributions. They cover 90% of what you need during an incident.
To make the layout yours, open Fields Management with f, enable PPID, nTH (threads), and SWAP, then select RES as the sort column when memory is the focus. Save your layout with W so it persists across sessions. This turns top into a process dashboard you can trust every time you attach.
Tie it together: a steady workflow
First, take a quick snapshot with ps -eo ... --sort=-%cpu or --sort=-rss to capture a baseline you can paste into a ticket. Next, pivot to top to watch the system in motion, sort by the metric that matters, and confirm trends rather than one-off spikes. Finally, return to ps for focused listings you can archive or diff. This loop gives you both reproducibility and live context without switching tools again and again.
Practical recipes you will reuse
Find the heaviest memory consumers and keep the output clean:
ps -eo pid,user,stat,rss,%mem,command --sort=-rss | awk 'NR==1 || $5>0' | head -n 25Watch one service’s worker pool settle after a deploy:
watch -n 1 "ps -C gunicorn -o pid,%cpu,%mem,stat,etime,cmd --sort=-%cpu | head -n 12"In top, focus on one service and its children:
Open top, press /, type part of the command (for example postgres), then press V to show only processes in the same process group when useful. Toggle full command lines with c to confirm you are looking at the right workers.
Interpreting the summary lines in top
Look first at load averages and CPU breakdown. High %id (idle) with sluggishness usually points to I/O wait (%wa) or run queue contention shown by high load average relative to CPU count. Memory lines report total, used, free, and buffers/cache; rising swap activity with steady RSS often reflects cache reclaim rather than process bloat. Use 1 to reveal per-CPU utilization if one hot thread pins a core while the average looks fine. These interpretations map directly to fields top exposes.
When you must act
From top, press k to send a signal to a stuck process, or r to lower a noisy worker’s priority while you investigate. From ps, use kill -TERM <pid> first and escalate to -KILL only if the process ignores a graceful exit. Combine pgrep or pidof to target the right PIDs, then confirm in a filtered top view that the system recovers. These controls are designed for live remediation without leaving your terminal.
Save time with consistent formats
Settle on one or two ps -eo ... formats per team and keep them in shell aliases. Persist your top layout with W so every login starts from your preferred fields and sort key. Over time this consistency reduces the time to first signal and makes your pasted evidence comparable across hosts and weeks. The tools are old because they are dependable once you shape them to your needs.