

Most Linux servers appear “low on RAM” at first glance because the kernel aggressively uses spare memory to cache files and speed up disk I/O. That behavior is healthy, but it confuses dashboards and new operators. In this guide you’ll learn a practical, reliable way to read memory on any Linux box using two sources of truth: the free command and /proc/meminfo. If you’re running on a cloud VM such as a DigitalOcean Droplet, you’ll also want a DigitalOcean account so you can contrast these readings with the platform’s monitoring graphs as you go. We’ll start with quick reads, then drill into each field so you can explain “where the RAM went” with confidence.
What free actually reports
Run free to get a compact snapshot. By default, it parses /proc/meminfo and summarizes physical and swap memory, including buffers and caches.
free -h

#               total        used        free      shared  buff/cache   available
# Mem:           961Mi       646Mi       133Mi        60Mi       396Mi       315Mi
# Swap: 0B 0B 0BFocus on three columns: total, used, and available. available is the most decision-useful number in modern kernels (≥3.14): it estimates how much RAM the system can give new workloads without swapping, accounting for reclaimable cache and slab. Do not equate “low free” with “out of memory”; Linux keeps free tiny by design so RAM isn’t idle. When in doubt, trust available over free.
For a live view during tests or load, watch free in a loop.
watch -n 1 free -mThis shows cache growth and reclamation second by second. As cache grows under file activity, used increases but available stays healthy; under real pressure, available falls toward 0, and swap or the OOM killer becomes likely. Tie this to your actions (e.g., starting a memory-heavy process) to confirm causality.
Read /proc/meminfo for ground truth
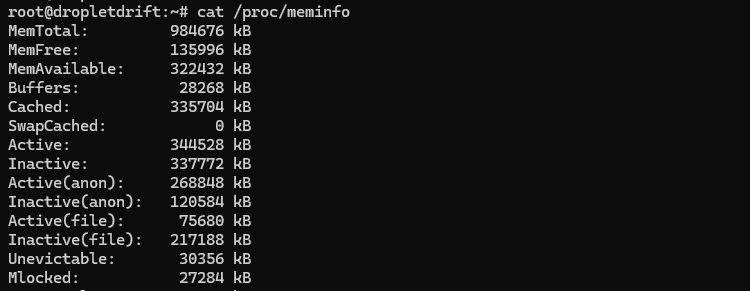
Everything free shows comes from /proc/meminfo, which is the kernel’s detailed ledger. Print it, then filter the key fields.
cat /proc/meminfoStart with these definitions: MemTotal is total usable RAM; MemFree is completely unused RAM; MemAvailable is an estimate of RAM you can allocate without swap; Buffers is filesystem metadata; Cached is page cache (file contents); SReclaimable is reclaimable slab (kernel caches). These fields are in kibibytes (KiB), so divide by 1024 for MiB or by 1048576 for GiB. Reading them directly lets you compute the same aggregates that tools display.
Extract just what you need:
grep -E 'Mem(Total|Free|Available)|Buffers|Cached|SReclaimable|Swap(Total|Free)' /proc/meminfoIf you want a quick MiB view:
awk '/MemTotal|MemFree|MemAvailable|Buffers|Cached|SReclaimable|SwapTotal|SwapFree/ {printf "%-15s %8.1f MiB\n",$1,$2/1024}' /proc/meminfo

# MemTotal:          961.6 MiB
# MemFree:           111.5 MiB
# MemAvailable:      293.3 MiB
# Buffers:            27.6 MiB
# Cached: 327.6 MiBThese snippets keep you aligned with the kernel’s own numbers and avoid misinterpretation caused by differing GUI conventions. As you compare, remember that MemAvailable already internalizes how much of Cached and SReclaimable can be reclaimed quickly.
Make sense of “used”, “free”, and cache
Linux deliberately fills RAM with cache so that disk operations are faster. That’s why MemFree is often tiny on healthy systems. The kernel will drop cache under pressure, so cache is available in practice even though it shows up as “used” in naive views. Read “used” as “in use by processes + kernel + caches” and prefer available for capacity decisions.
The Buffers vs Cached split reflects different roles: buffers track filesystem metadata and block-level bookkeeping; cache holds file pages you’ve actually read or written. Both speed I/O and both are candidates for reclamation; cached file pages are typically larger contributors on general-purpose systems. Treat large cache as a performance win, not a leak.
Sanity-check your intuition with small experiments
Read a large file and watch page cache grow; then read it again and note the speedup because data is served from RAM.
# create a 2 GiB file (adjust size to your disk space)
dd if=/dev/zero of=bigfile bs=1M count=2048 status=progress
sync

# first read (populate cache)
time dd if=bigfile of=/dev/null bs=4M status=none

# check memory
free -h

# second read (should be faster due to cache)
time dd if=bigfile of=/dev/null bs=4M status=none

# check memory again
free -hYou should see Cached rise after the first read while MemAvailable remains healthy; the second read should be faster. This demonstrates why “high used” isn’t automatically a problem: the kernel is working for you. If MemAvailable collapses during normal workload, that’s when you investigate.
Compute “effective used” and “headroom” like a human
When answering “how much RAM is truly used?”, a practical rule is:
effective_used ≈ MemTotal − MemAvailable
headroom ≈ MemAvailableThose approximations match how the kernel estimates reclaimable memory and are more predictive of swap/pressure than MemFree. If you must mirror the older free heuristic, you can also compute used_without_cache ≈ MemTotal − (MemFree + Cached + SReclaimable), but prefer MemAvailable where supported. This framing keeps your dashboards and shell output consistent.
Tie it back to processes and swap
If MemAvailable trends down and swap begins to rise, the system is under memory pressure. Confirm by checking swap fields and the top memory consumers.
# swap status and top memory users
grep -E 'Swap(Total|Free|Cached)' /proc/meminfo
sudo smem -tk | head # if smem isn't available, use: ps aux --sort=-%mem | headSustained growth in swap alongside low MemAvailable signals the need to reduce workload RSS, adjust caches, or add RAM. If SwapTotal is 0, any hard pressure will result in the OOM killer rather than paging; decide whether you want a small swap file to soften spikes or truly swapless behavior for fail-fast semantics.
Cross-check with platform monitoring
Cloud provider graphs can look alarming because they often plot “used” as “not free,” which includes caches. Compare those graphs to MemAvailable before declaring an incident. On a Droplet, enable DigitalOcean Monitoring and overlay its memory graph with your free readings during a test; divergent interpretations usually vanish once you account for cache. This habit reduces false positives and aligns on the kernel’s own estimates.
Quick reference: mapping free to /proc/meminfo
free’s available column ≈ /proc/meminfo:MemAvailable. The used column is derived, not a raw field; on newer free it is MemTotal − MemFree − Buffers − Cached − SReclaimable for the main line, and the tool shows available explicitly to avoid confusion. total is MemTotal (plus SwapTotal on the swap line). Knowing these relationships helps reconcile shell output with kernel counters and documentation.
Common pitfalls and how to avoid them
First, do not read MemFree as “capacity left”; it ignores reclaimable caches and kernel slabs. Second, do not add Cached wholesale to “used” when arguing that the system is out of memory; the kernel will drop much of it instantly under pressure. Third, be consistent with units: /proc/meminfo reports KiB; convert before comparing to GiB dashboards. These practices prevent over-provisioning and needless firefighting.
When to escalate
Escalate when MemAvailable stays low (for example, <5–10% of MemTotal) and you observe swap growth or OOM events; that combination reflects real contention. If the culprit is one or two processes with large resident sets, fix the workload; if the pressure comes from many moderate processes, right-size the VM. If cache alone is big while MemAvailable is healthy, do nothing; that cache is buying you latency. These thresholds are easier to defend because they mirror the kernel’s model.
Summary you can apply today
Use free -h and watch the available column; corroborate with /proc/meminfo fields (MemAvailable, Cached, SReclaimable) to explain where memory resides. Treat big caches as normal, and reserve concern for sustained low MemAvailable with swapping or OOM. If you’re on a DigitalOcean Droplet, enable platform monitoring and compare its graphs to these kernel metrics so your picture of “used” aligns with reality. With these habits, you can triage memory issues quickly and explain them clearly to any stakeholder.
Assumptions: Linux kernel ≥3.14 (for MemAvailable) and typical general-purpose distributions; all examples run as a non-root user unless noted.