


You know that awkward moment in a concept test when the room wants certainty—“Will this launch work?”—and all you’ve got are five squishy boxes from “definitely not” to “definitely yes.” We’ve lived with that fuzziness for decades. It’s familiar. It’s also expensive. And slow. And honestly, panels drift, people satisficing is a thing, and the distributions don’t always feel real.
So when a new paper dropped on October 9, 2025, with a title only a researcher could love—“LLMs Reproduce Human Purchase Intent via Semantic Similarity Elicitation of Likert Ratings”—I did the double take you probably did too. Big promise. Odd phrase. But there’s a simple idea hiding in there that just… works.
Here’s the punchline in plain English: don’t ask an LLM to spit out a number on a 1–5 scale. Let it talk like a person first, then translate that text into a Likert rating by measuring how close its words are to a set of anchor statements. That translation step is the trick they call Semantic Similarity Rating (SSR). The authors put it like this: SSR “maps [textual responses] to Likert distributions using embedding similarity to reference statements.”
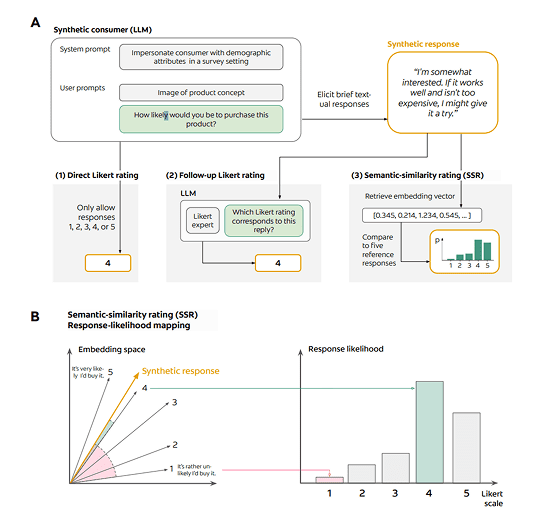
Why does that matter? Because when you ask a model for a number, it tends to behave badly—cramped ranges, weird skews, distributions that don’t look human. The paper shows this is more about how we ask than what the model knows. Switch to free text first, then map that text to the scale by computing cosine similarity against five short anchors (“definitely not” through “definitely yes”), and the distributions suddenly look like actual survey data. Or as the methods section explains, the free-text is “projected onto a 5-point Likert scale by computing the cosine similarity of embeddings with those of predefined anchor statements.”
Now the evidence—the part that either earns your trust or doesn’t. The team (PyMC Labs folks alongside Colgate-Palmolive researchers) tested SSR on 57 real personal-care concept surveys with 9,300 human responses. On that benchmark, SSR “achieves 90% of human test–retest reliability while maintaining realistic response distributions (KS similarity > 0.85).” Read that again: not perfect, not magic, but ninety percent of what humans manage to reproduce when you ask them twice. That’s a strong baseline.
Two details worth sitting with:
First, distribution shape. The authors emphasize that direct, numeric ratings from LLMs produce unrealistic histograms; SSR restores the messy, human look of the data, with that Kolmogorov–Smirnov similarity north of 0.85 across studies. In other words, you’re not just matching means—you’re recovering the feel of a real panel.
Second, rank-ordering. Marketers don’t live in the land of absolute truth; we live in comparisons. Will concept A beat concept B? Here again, SSR nails what matters: concept rankings that “attain over 90% of the maximum correlation with human data, based on test–retest reliability.” That phrasing is careful, and it should be. The ceiling here is what humans can agree on with themselves over time, and SSR gets most of the way to that ceiling.
A quick tour under the hood so we’re not waving hands. The workflow is three beats. One, prompt the model like a person—sometimes with a persona, sometimes not—and ask for a brief, natural explanation of whether they’d buy. Two, don’t force a single number; instead compare that text against five anchor sentences, one per Likert point, using embeddings and cosine similarity to get a probability for each point. Three, average across multiple anchor sets to reduce anchoring brittleness and get a stable probability mass function for each response. The paper documents all three paths they tested (direct Likert, follow-up Likert after text, and SSR) and shows SSR is the one that consistently produces human-like distributions and reliable rankings.
If you’re wondering about generality, so am I. The dataset is rich but domain-specific: personal-care concept tests from a large CPG player, with authors from PyMC Labs and Colgate-Palmolive on the masthead. It’s encouraging that the results held across different foundation models (including GPT-4o and Google’s “Gem-2f” in the figures), but replication outside this category is the next grown-up step. Still, as a method paper, this is credible and transparent—there’s even a small open-source implementation of SSR you can inspect and adapt.
Zooming out for a second. This study doesn’t live in a vacuum. Researchers have been probing whether synthetic respondents can stand in for expensive panels for a couple of years now. Brand and colleagues at Harvard (2023) explored LLMs for market research by generating multiple responses per question and studying their distributions. The through-line is the same: stop fixating on one “answer,” focus on the distribution. SSR just gives that idea sharper teeth by tying free text to familiar Likert metrics with an interpretable bridge.
What I like about this paper—beyond the stats—is that it respects how insights people actually work. We don’t just want a score; we want the why. SSR preserves the qualitative rationale that made you nod in past focus groups: “I like that it’s easy to use,” “I’d try it if the price is right,” that kind of texture. The mapping step turns those reasons into numbers you already report out. Different stakeholders get what they need without inventing new dashboards.
And I’m going to say the quiet part out loud. This doesn’t prove you can forecast sales off synthetic people. Not yet. What it shows—honestly, what it proves on this dataset—is that you can reproduce human panel outcomes well enough to run cheaper, faster, earlier iterations that behave like your panels. That’s a step change for concept screening. Use it as a complement. Keep humans in the loop where it matters. Treat the synthetic sample as a wind-tunnel, not the real sky.
If you want to try this without boiling the ocean, do something boring and effective. Take five past concept tests you trust. Rerun them with SSR, blind to the answers. Compare distribution shapes, average PI, and the rank order of the concepts. If the match looks like this paper’s—“90% of human test–retest reliability”—graduate to using SSR as a pre-screen before you burn budget on a full panel. Keep the anchor statements simple, average across a few phrasings, and log the qualitative justifications, because that’s where creative teams will learn. And keep a holdout human survey every so often so you don’t fool yourself.
Look, none of us gets a crystal ball. But this is close to something practical: a way to let an AI talk like a consumer, then translate that talk—faithfully, transparently—back into the numbers your org already speaks. It’s the first approach I’ve seen that makes synthetic respondents feel less like a gimmick and more like a tool.