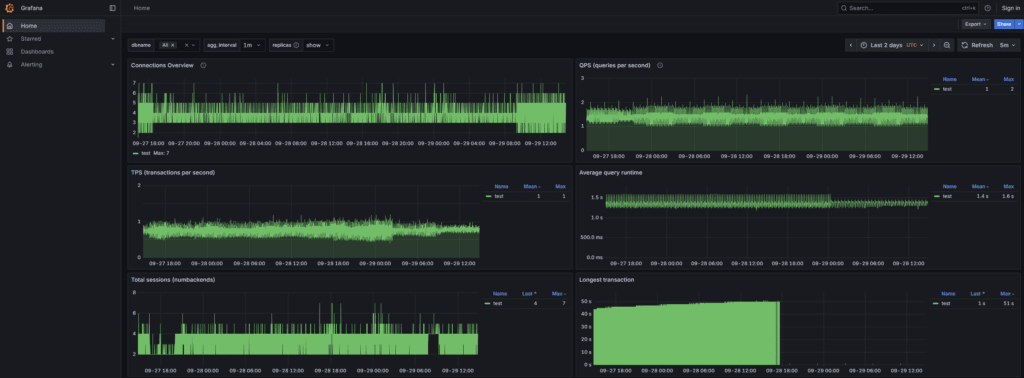
CYBERTEC has announced the release of pgwatch v4, the latest version of its popular open-source PostgreSQL monitoring stack. This release brings a significant set of new metrics, fresh Grafana dashboards, and usability improvements aimed at making database monitoring more powerful and easier to manage.
You can see pgwatch v4 in action on demo.pgwatch.com, and review the full changelog on GitHub.
Highlights in pgwatch v4
With PostgreSQL 18 introducing asynchronous I/O (AIO) and expanding pg_stat_io, pgwatch v4 now surfaces the new data:
total_XXX_timecolumns added to table_statsread_bytes,write_bytes,extend_bytesin stat_io- WAL statistics collected via
pg_stat_io archiver_pending_countnow usespg_ls_archive_statusdir()- New fields in checkpointer (
num_done,slru_written) - New fields in db_stats (
parallel_workers_to_launch,parallel_workers_launched)
These additions ensure pgwatch stays aligned with the latest PostgreSQL internals.
Grafana Dashboards

Monitoring visualization gets a big upgrade:
- New dashboards for Grafana v12 (support for v10 has been dropped)
- Global Database Overview with 26 panels — covering replication, connections, index usage, and more (inspired by postgres.ai)
- Database Overview now with 21 panels, including time lag metrics and better visuals
- Query Performance Analysis — enhanced table with 17 query metrics and 8 visualization panels
- Tables Overview — treemap views for table sizes, bloat, and index usage
Metrics & Sinks
- Realtime metrics deprecated — replaced by a more maintainable approach where metrics are loaded from organized folders.
- gRPC sink enhanced with basic authentication support and improved documentation.
Development & Contributions
- Docker Compose workflow simplified for easier development and testing.
- New pgwatch-contrib repository launched, hosting community extensions and sample gRPC sinks.


